Before breaking ground, it is important to carry out a utility survey to detect and map out underground utilities. Failure to do so can lead to increased project costs and delays. It can also pose a threat to your employees’ health and safety. Underground utility detection surveys are a series of non-intrusive measurements that can be used across all locations and for all rural, commercial and industrial projects.
Cost and time saving on a project are some of the biggest benefits of using a utility detection survey. It can help reduce the risk of errors, ensuring that companies are not liable for any damage caused due to their project. Underground utility survey includes Ground Penetrating Radar (GPR), 3D Model Surveys, Connectivity Survey (sewer & drainage), and Monitoring 3D Manhole Surveys.
GTS offers full-fledged utility detection services in Oman. Depending on the client requirements, we offer best-in-class underground utility detection surveys that meet industry standards and are in compliance with local regulation laws. We can also deliver the information obtained from the survey in several formats so that they could be easily used for various on-site and in-office purposes.
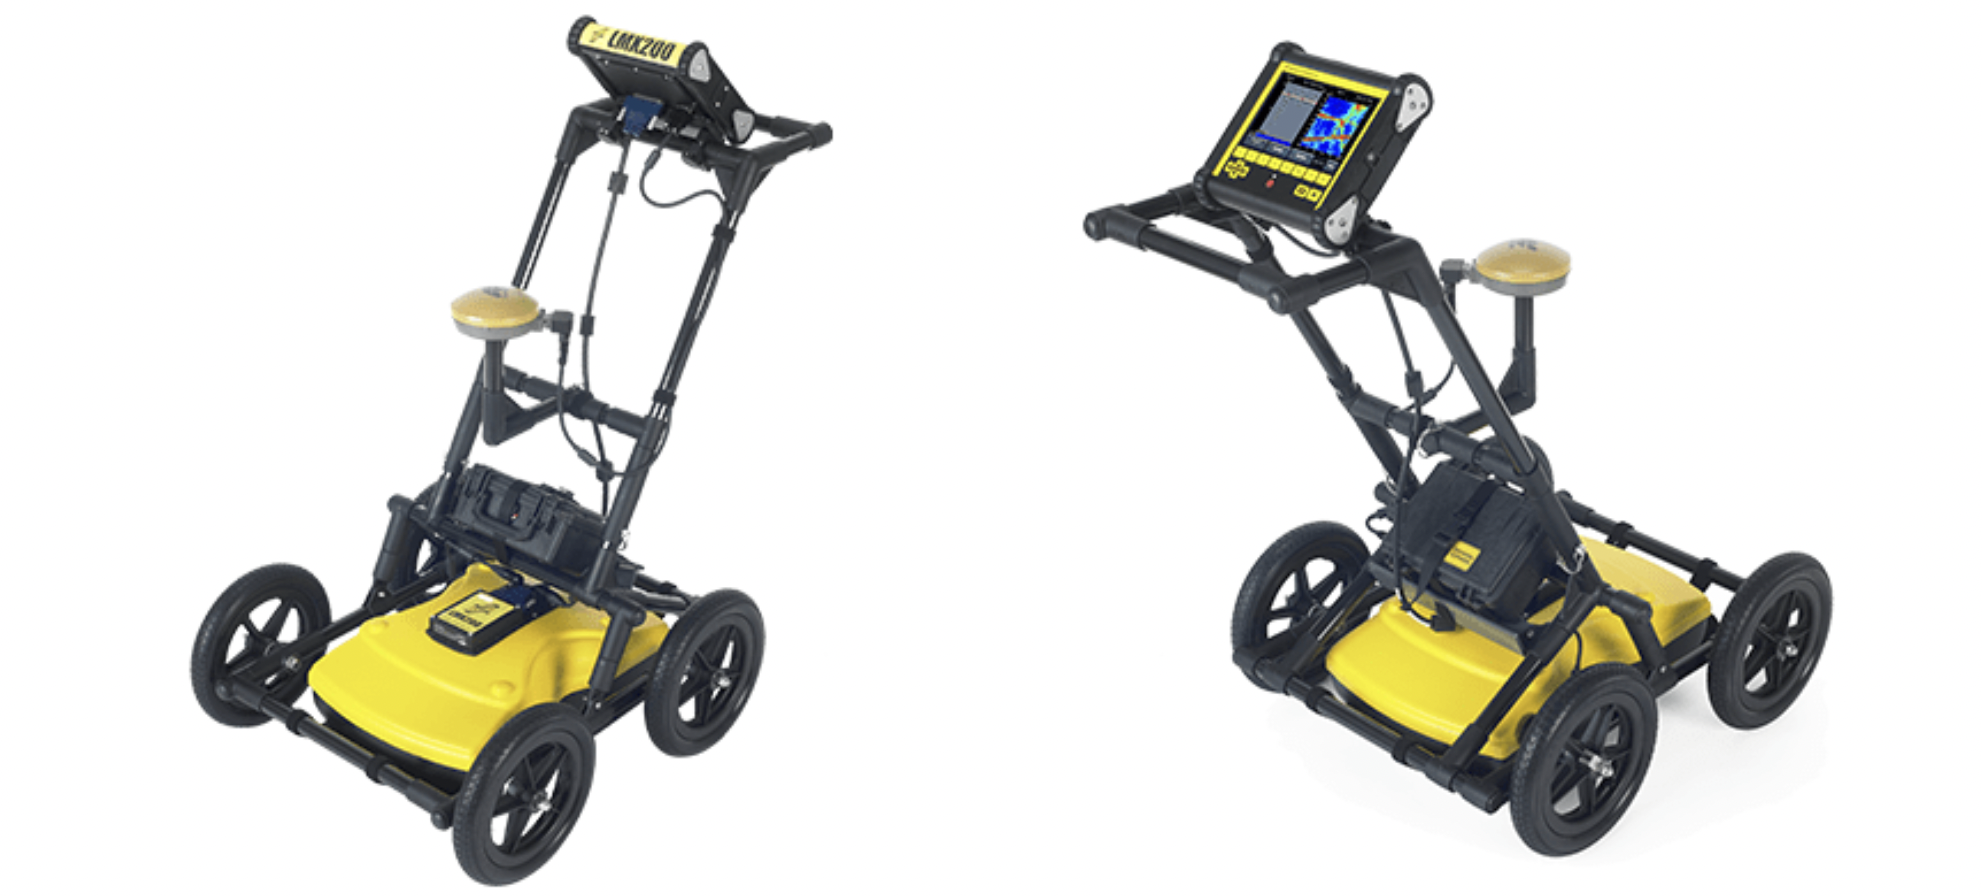
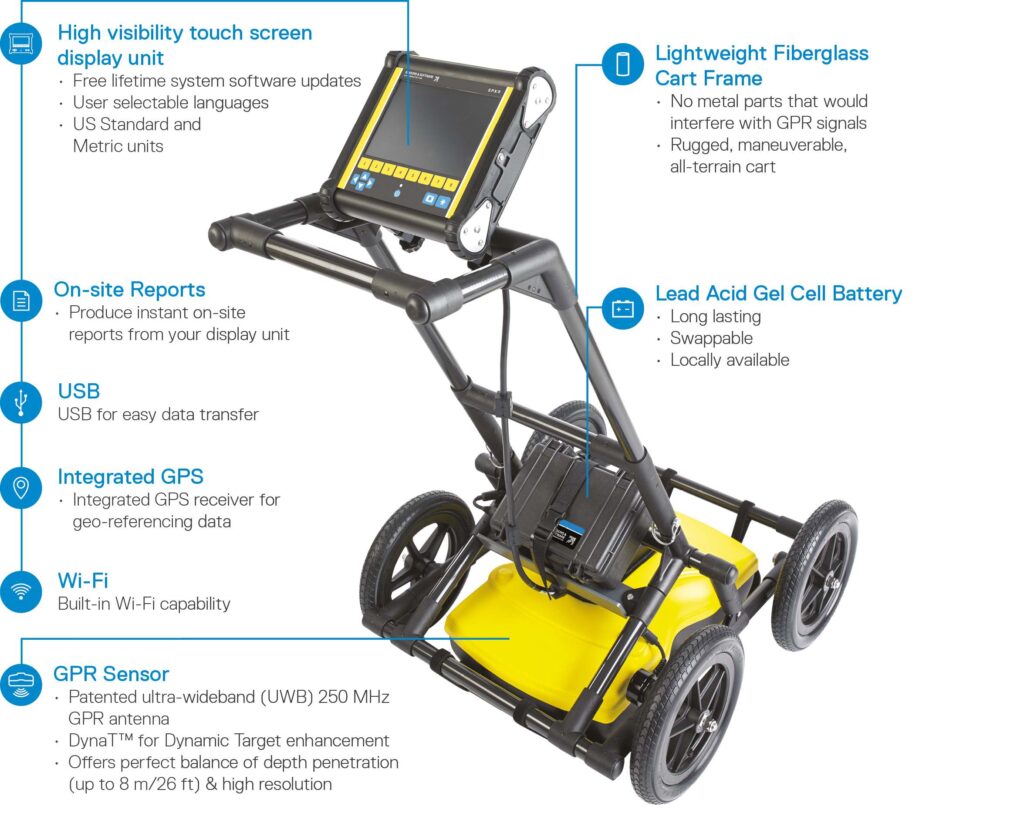
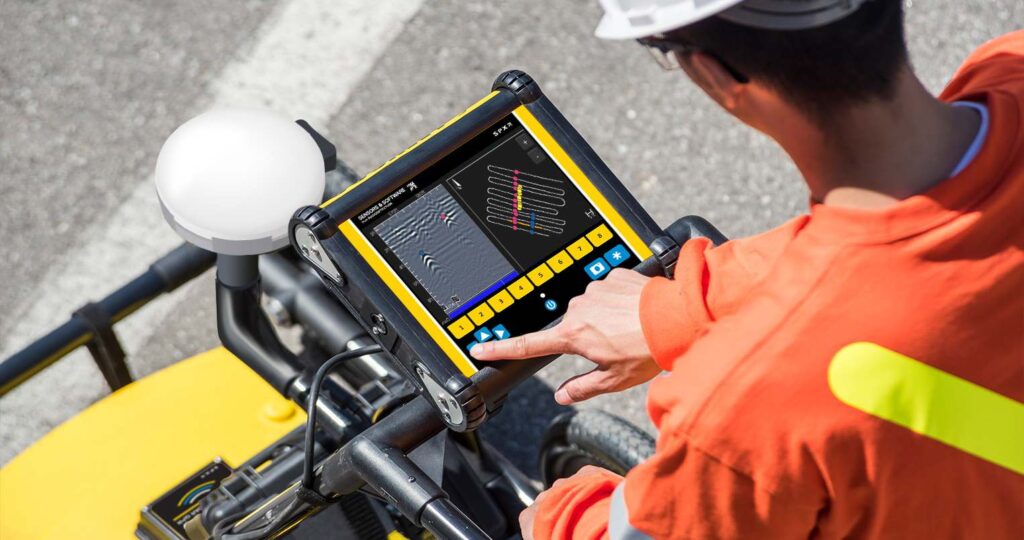
LMX200™
Utility locating GPR system
Utility locating with GPR made simple
The LMX200™ provides unprecedented insights and target confidence to detect traditionally non-locatable subsurface features such as:
Metal utilities, including pipes and cables
Non-metallic pipes, including PVC and asbestos cement
Concrete storm and sewer systems
Utilities where installed tracer wiring has failed
Underground storage tanks and drainage tiles
Septic system components
Non-utility structures such as vaults, foundation walls and concrete pads
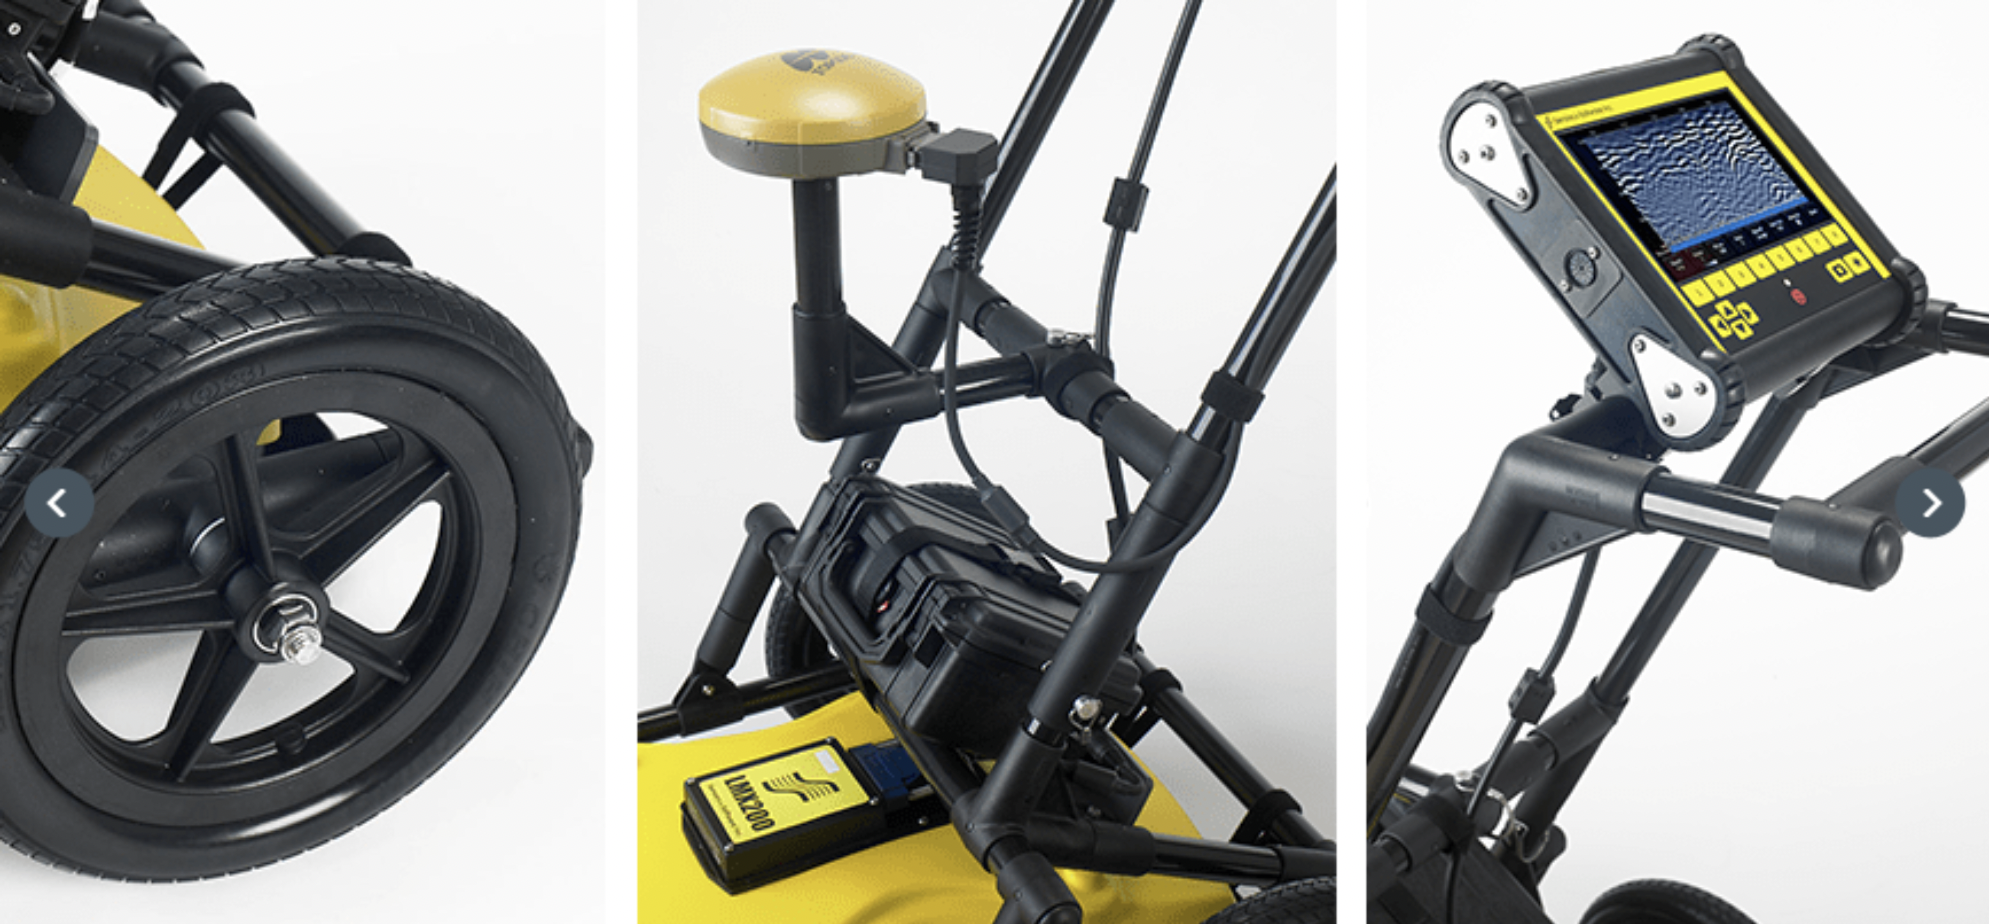
Public utility systems and local governments require that the positions of underground systems are located and marked. This helps in planning projects and avoiding risks and hazards. The LMX200™ builds on the capabilities of the LMX100™ and adds further features to help you locate and map these utilities. It adds the powerful Grid Scan mode and the ability to use an external GPS to take full advantage of SplitView and MapView. The LMX200™ also allows data export for post-processing, archiving, reference and further mapping capabilities in EKKO_Project™
LMX200™ Features
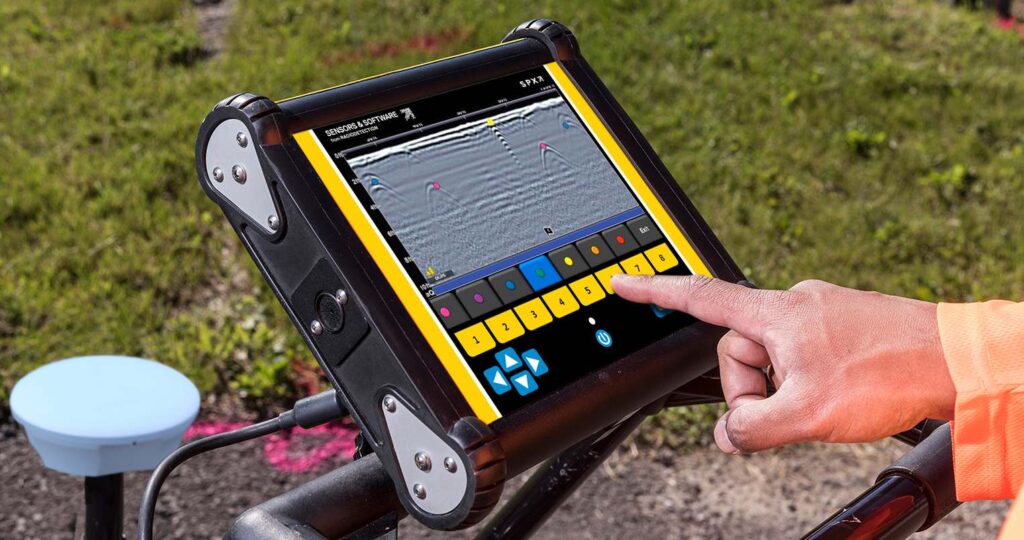
In-field visualization features
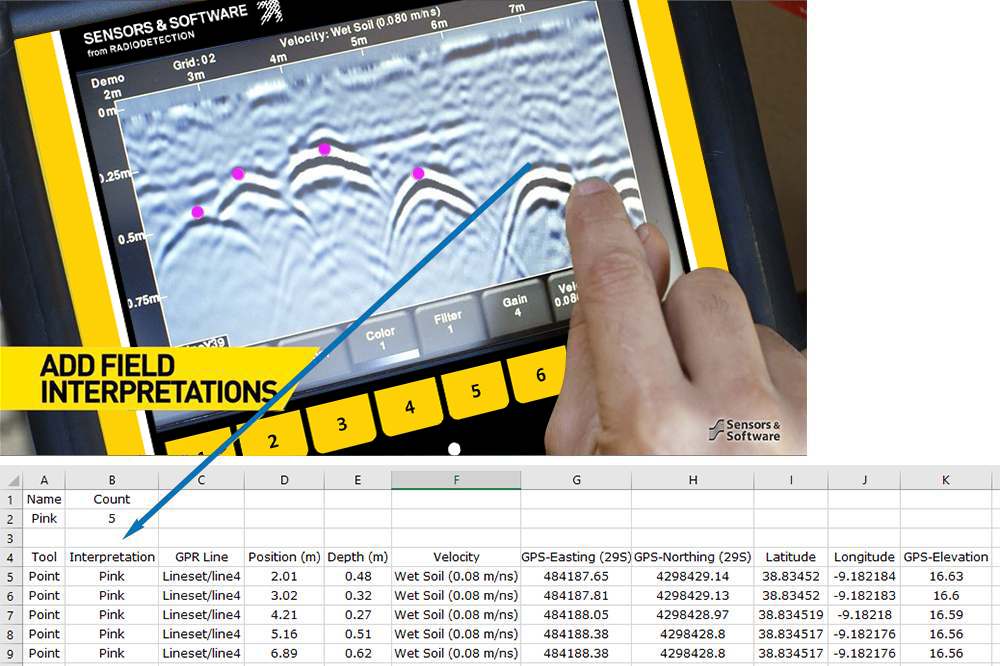
Interpretations
Classify your targets in real time with field interpretations. Simply touch the screen and select from a range of color-coded options.
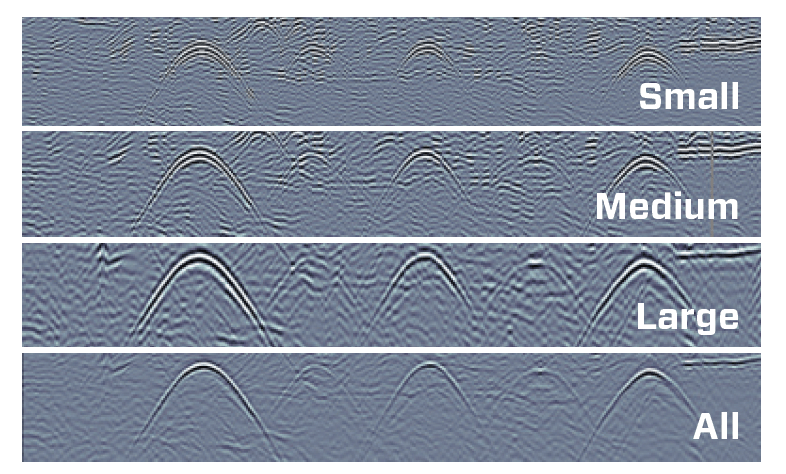
Dynamic Target Enhancement (DynaT™)
DynaT™
DynaT™ is our patented Dynamic Target enhancement feature that optimizes views of small, medium and large targets. These views can be toggled to reveal additional subsurface features, giving you unprecedented insights and target confidence in the field.
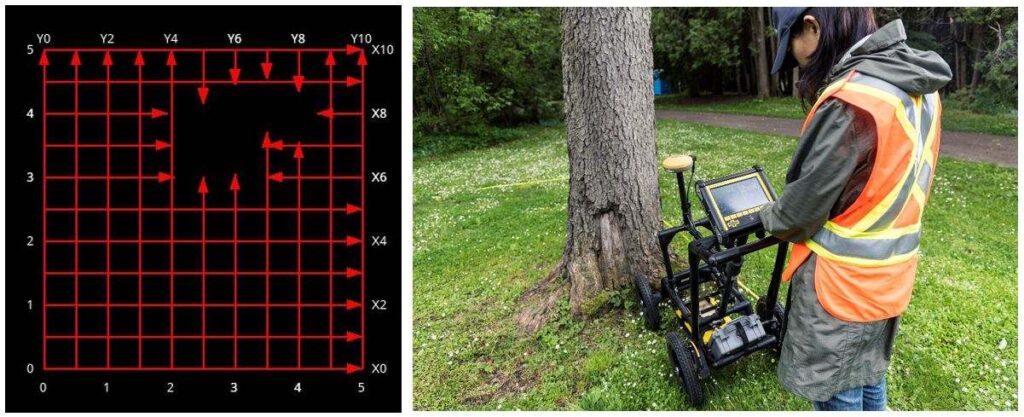
Grid Scan Mode
Simple grid setup and guided grid collection on the display unit
Select from 4 standard grid sizes. The system guides you through the grid setup and collection.
Flexible grid line collection with added Obstacle Avoidance feature
The system guides you through collecting a grid around an obstacle. You can also collect odd shaped grids by just ending lines short or skipping lines altogether.
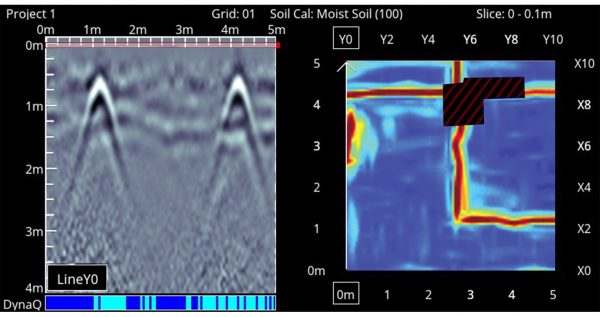
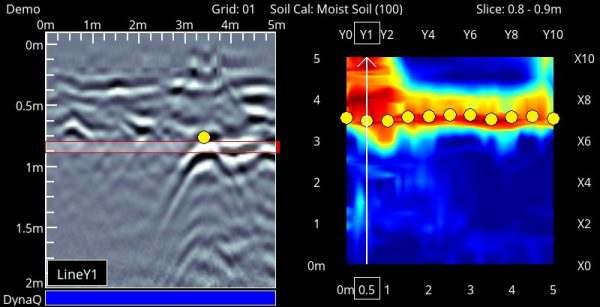
SliceView
Generate depth slices from both complete and incomplete grids in the field at the touch of a button.
View, save and share your collected grid in the field
View grid lines, flags or field interpretations that were collected in conjunction with the depth slice image on the right. You can then at a glance correlate your interpretations to depth slice images.
Additional Capabilities with External GPS
SplitView
Combines the benefits of LineView and MapView onto one screen. The MapView side of the screen shows all the GPR data that has been collected and where the LMX200™ is currently located in the survey area while the LineView side displays your cross-section data to quickly see the spatial relationship between targets and determine if a series of hyperbolas are in linear orientation.
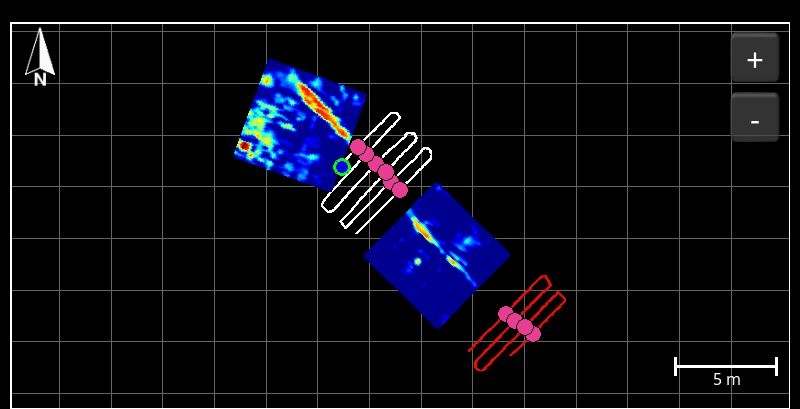
MapView display
Display a powerful and meaningful bird’s eye view of your site map with survey path, depth slices, field interpretations, flags and collected lines in MapView
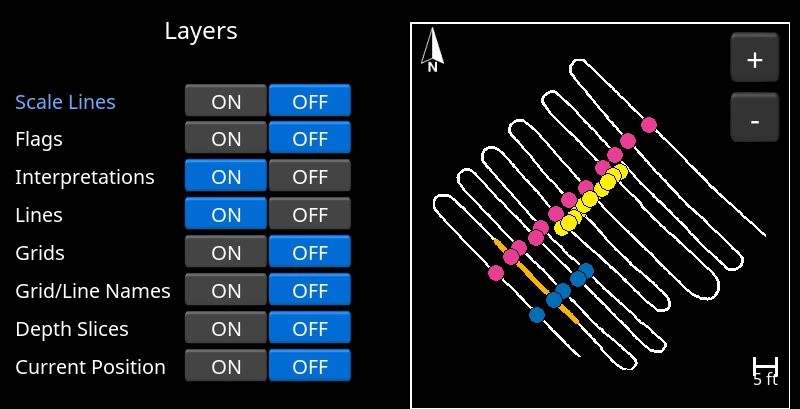
MapView Layers
Toggle on and off multiple layers to optimize your view to generate a more complete picture of your full site, and capture in screenshots to augment your reports right from the display unit
Numerous data export possibilities
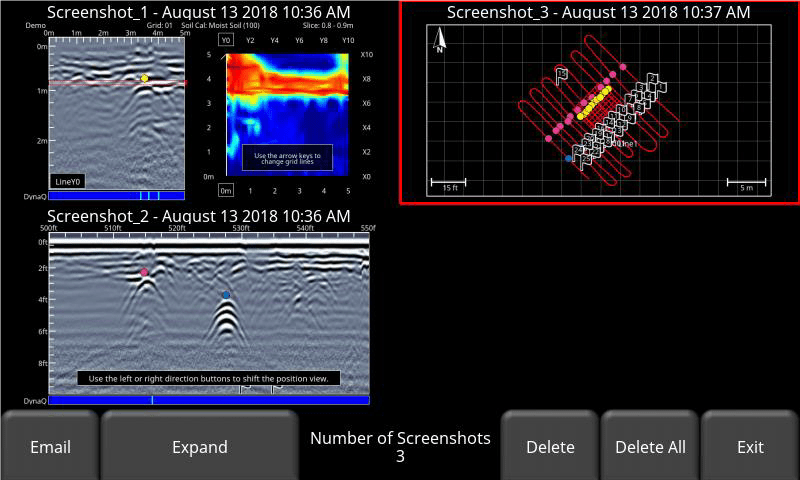
Easily review and share captured screenshots in Wi-Fi mini reports
The Screenshot Gallery displays a Tile View of screens saved by pressing the Camera button. Select a screenshot to email it in a mini-report.
Share findings quickly directly from the field
Produce instant reports from your display unit that includes screen captures of line, grid and MapView information.
Field Interpretations file (.CSV)
Interpretation information added in the field are automatically saved in a CSV file that contains depth, position and GPS coordinates.
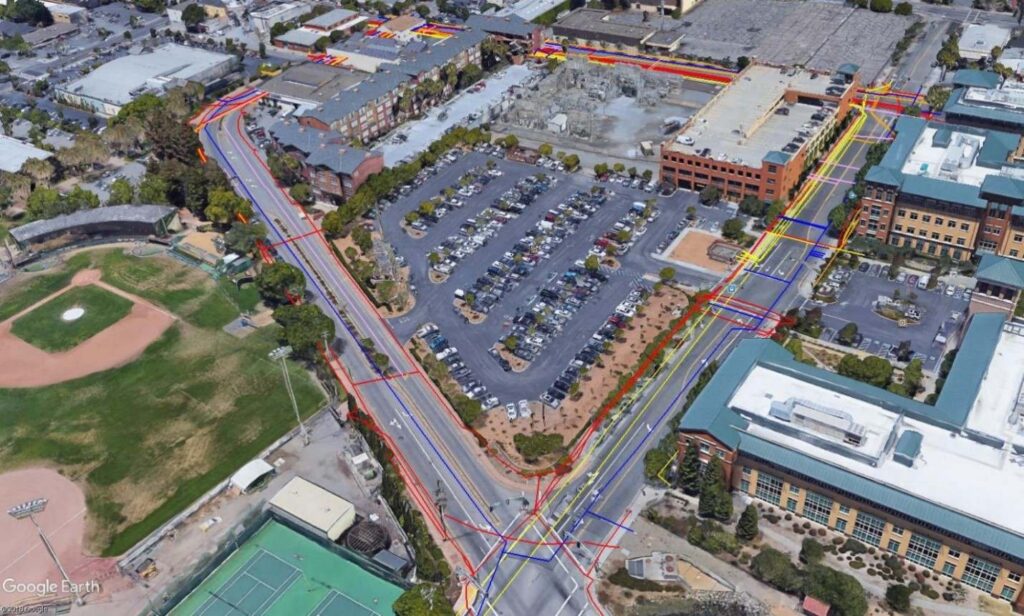
Google Earth™ files (.KMZ)
Survey paths and field interpretations are automatically exported to .KMZ files for viewing in Google Earth™. Generate stunning utility maps by plotting interpretations on GIS or aerial images and connecting them to show the utility paths.